Base Maps
This example reviews adding a basemap to a GeoDataFrame plot.
[1]:
import geopandas as gpd
import mapped
import contextily as ctx
mapped.__version__, gpd.__version__, ctx.__version__
[1]:
('20.04.01', '0.7.0', '1.0.0')
[2]:
nybb = gpd.read_file(gpd.datasets.get_path('nybb'))
Importing mapped monkeypatches geopandas to add several features to the geopandas.GeoDataFrame.plot method.
- It adds the keyword argument
basemap, which adds a contextual background map to plots. Set toTrueto get as default Positron style raster tiles from Carto. - It attaches the coordinate reference system (
crs) as an attribute onto the returnedAxesobject, which can then be automatically applied as a reprojection to any other geographic data plotted on the same set of axes.
[3]:
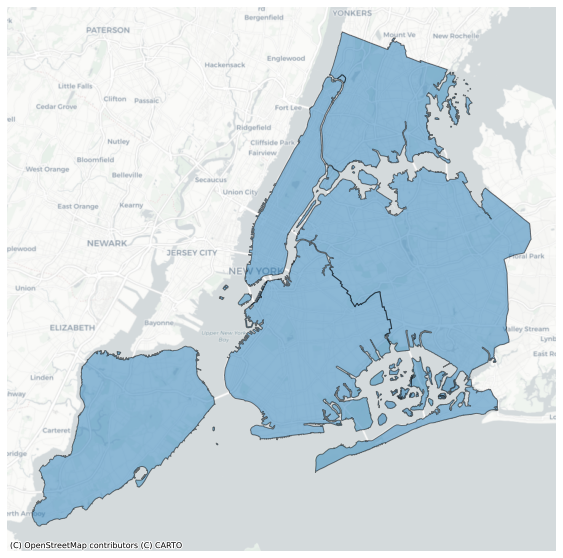
nybb.plot(figsize=(10, 10), alpha=0.5, edgecolor='k', basemap=True);

Or set to a string naming a style offered by contextily to get other map styles. See a list of tile providers here.
[4]:
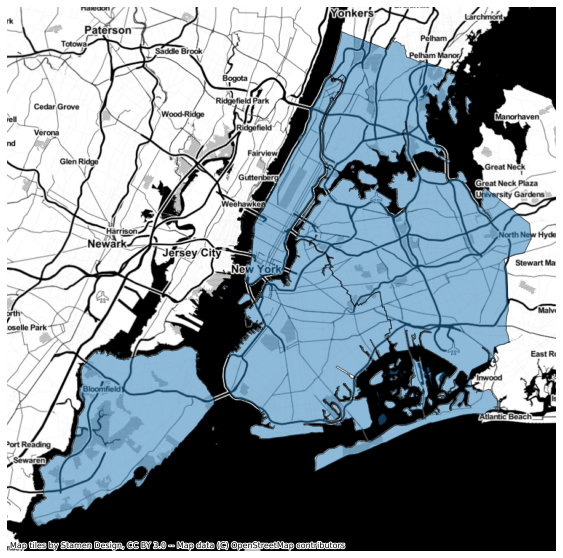
nybb.plot(figsize=(10, 10), alpha=0.5, edgecolor='k', basemap='Stamen.Toner');
[5]:
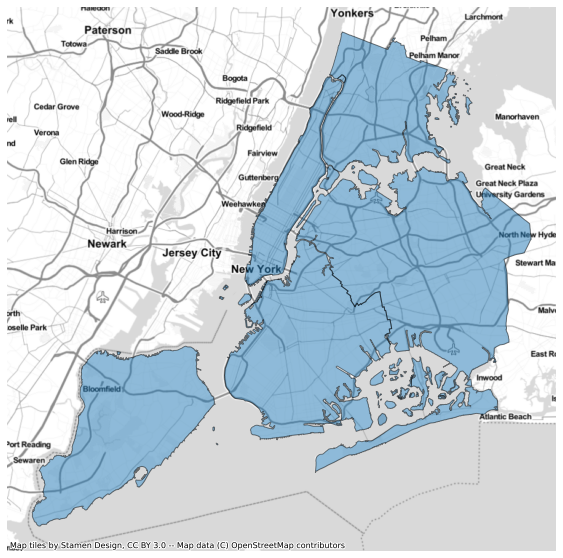
nybb.plot(figsize=(10, 10), alpha=0.5, edgecolor='k', basemap='Stamen.TonerLite');
[6]:
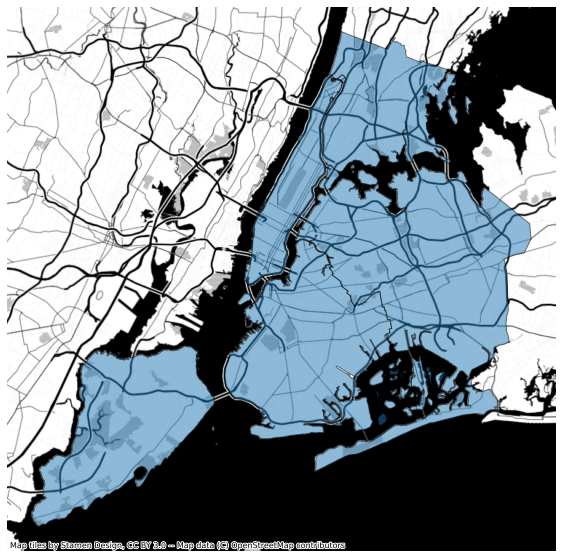
nybb.plot(figsize=(10, 10), alpha=0.5, edgecolor='k', basemap='Stamen.TonerBackground');
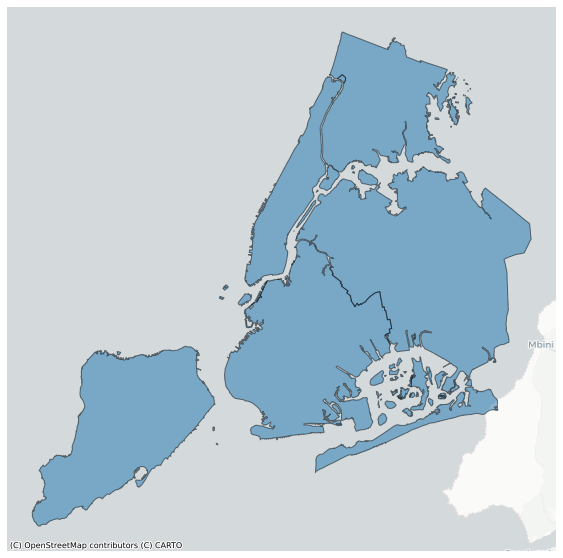
Note that a coordinate reference system (crs) must be defined on the GeoDataFrame if it is not already in Web Mercator (EPSG:3857). Otherwise, the map tiles will probably not align correctly and you will get unexpected results.
[7]:
nybb2 = nybb.copy()
nybb2.crs = None
nybb2.plot(figsize=(10, 10), alpha=0.5, edgecolor='k', basemap=True);
As noted above, when calling the plot method, the CRS is attached to the subplot axes as crs, and this is used to ensure that subsequent map objects drawn to the same axes are rendered correctly, even if they use a different CRS. Here we demonstrate this by loading a shape from OpenStreetMap using the OSMnx package, which delivers the shape with WGS84 coordinates.
[8]:
import osmnx as ox
newark = ox.gdf_from_place("Newark, NJ")
[9]:
newark.crs
[9]:
<Geographic 2D CRS: +proj=longlat +ellps=WGS84 +datum=WGS84 +no_defs + ...>
Name: unknown
Axis Info [ellipsoidal]:
- lon[east]: Longitude (degree)
- lat[north]: Latitude (degree)
Area of Use:
- undefined
Datum: World Geodetic System 1984
- Ellipsoid: WGS 84
- Prime Meridian: Greenwich
[10]:
nybb.crs
[10]:
<Projected CRS: EPSG:2263>
Name: NAD83 / New York Long Island (ftUS)
Axis Info [cartesian]:
- X[east]: Easting (US survey foot)
- Y[north]: Northing (US survey foot)
Area of Use:
- name: USA - New York - SPCS - Long Island
- bounds: (-74.26, 40.47, -71.8, 41.3)
Coordinate Operation:
- name: SPCS83 New York Long Island zone (US Survey feet)
- method: Lambert Conic Conformal (2SP)
Datum: North American Datum 1983
- Ellipsoid: GRS 1980
- Prime Meridian: Greenwich
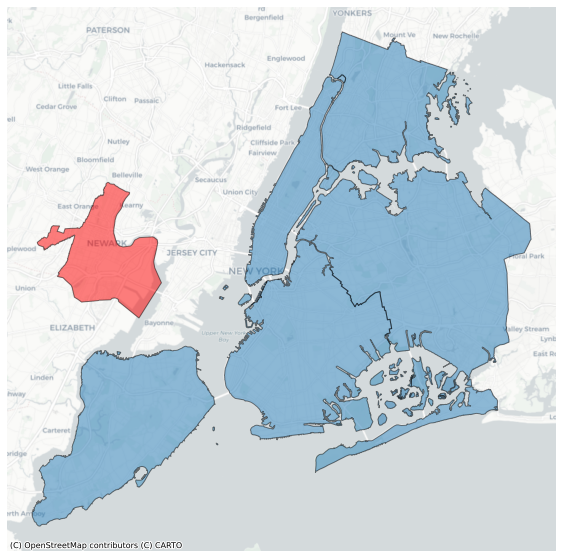
[11]:
ax = nybb.plot(figsize=(10, 10), alpha=0.5, edgecolor='k', basemap=True)
newark.plot(ax=ax, alpha=0.5, color='r', edgecolor='k');
Mapped also offers a seperate add_basemap method to attach a basemap to an existing matplotlib AxesSubplot.
[12]:
ax = nybb.plot(figsize=(10, 10), alpha=0.5, edgecolor='k')
mapped.add_basemap(ax);
This is particularly useful when you want to add multiple sets of overlay tiles, for example to add map labels floating above the objects you draw.
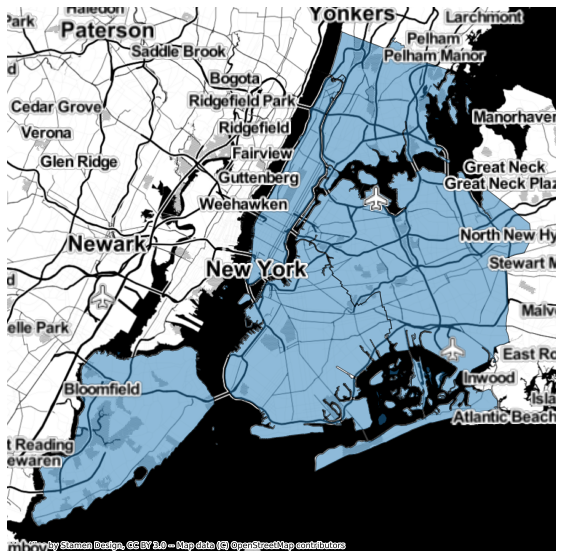
[13]:
ax = nybb.plot(figsize=(10, 10), alpha=0.5, edgecolor='k')
mapped.add_basemap(ax, tiles='Stamen.TonerBackground')
mapped.add_basemap(ax, tiles='Stamen.TonerLabels', zoom=10); # requires contextily PR #114
-
mapped.add_basemap(ax, zoom='auto', tiles='CartoDB.Positron', crs=None, epsg=None, axis='off', figsize=None, **kwargs)¶ Add a basemap to a matplotlib map plot.
Parameters: - ax (AxesSubplot) – The extent of the map is inferred from the axes, and the tiles are then rendered onto these axes.
- zoom (int, or ‘auto’) – The zoom level of the map tiles to download. Note that this does not actually change the magnification of the rendered map, just the size and level of detail in the mapping tiles used to render a base map. Selecting a zoom level that is too high will result in a large download with excessive detail (and unreadably small labels, if labels are included in the tiles).
- tiles (str) – The base url to use for the map tile, or a named value in contextily.sources, for example: “OpenStreetMap”, “Stamen.Terrain”, “Stamen.TonerLite”. See https://github.com/geopandas/contextily/blob/master/contextily/_providers.py for other possible values.
- crs (dict, optional) – The coordinate reference system of the map being rendered. Map tiles are all in web mercator (epsg:3857), so if the map is some other CRS, it must be given so that the correctly aligned tiles can be loaded. This function will also look for a crs attribute on ax, and it will prefer to use any crs defined there over a crs given here.
- epsg (int, optional) – You may specify a crs as an epsg integer here instead of using the crs argument.
- axis (str or None, default “off”) – Set to “off” to remove the axis and axis labels, or “on” to draw axis labels. Set to None to leave the axis settings unchanged.
- figsize (tuple) – The size of the map to render. This argument is passed to fig.set_size_inches.
Returns: Return type: AxesSubplot