Plotly Line Plot
This example reviews plotting a lines plot from a GeoDataFrame using plotly.
[1]:
import mapped
import geopandas as gpd
import plotly
mapped.__version__, gpd.__version__, plotly.__version__
[1]:
('20.04.01', '0.7.0', '4.6.0')
First, we’ll load some example network data using the OSMnx package. We’ll load a small
[2]:
import osmnx as ox
north, west, south, east = 41.88626, -87.6316, 41.87816, -87.61334
streets = ox.graph_from_bbox(north, south, east, west, simplify=False)
street_nodes, street_edges = ox.graph_to_gdfs(streets)
The “lanes” data from OSM in this area has a lot of missing entries, so we’ll fill those in with 1’s, and convert the column to integers.
[3]:
street_edges['lanes'] = street_edges['lanes'].fillna('1').astype(int)
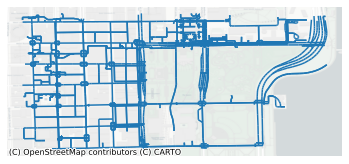
[4]:
street_edges.plot(basemap=True);
[5]:
street_edges.plotly_lines()
[6]:
street_edges.plotly_lines(width='lanes')
[7]:
street_edges.plotly_lines(color='highway')
[8]:
street_edges.plotly_lines(color='highway', width='lanes')
-
GeoDataFrame.plotly_lines(*, zoom='auto', mapbox_style=None, margins=0, figuretype=None, fig=None, color=None, width=None, suppress_hover=False, opacity=None, color_discrete_sequence=None, color_discrete_map=None, **kwargs)¶ Make a line map in a plotly FigureWidget.
Parameters: - gdf (geopandas.GeoDataFrame) – The lines to plot.
- zoom (‘auto’ or int or float) – Sets the initial zoom level for the map, up to 20.
- mapbox_style (str, optional) – Sets the style for the basemap tiles. Totally free options include “carto-positron”, “stamen-terrain”, “stamen-toner”, “open-street-map”, possibly others. Options from the set {‘basic’,’streets’,’outdoors’,’light’,’dark’,’satellite’, ‘satellite-streets’} will load vector tiles from MapBox, which requires a token to be set. This defaults to “carto-positron” if no mapbox token is set, or ‘basic’ if a token is available.
- margins (int, optional) – Set margins on the figure.
- figuretype (class, optional) – Which plotly figure class to use, defaults to plotly.go.FigureWidget.
- fig (plotly.go.Figure or plotly.go.FigureWidget) – An existing figure, to which the new trace(s) will be appended.
- color (str or int or Series or array-like) – Either a name of a column in gdf, or a pandas Series or array_like object. Values are used to assign color to lines.
- width (int (default None)) – Either a name of a column in gdf, or a pandas Series or array_like object. Values are used to assign widths to lines.
- opacity (float) – Value between 0 and 1. Sets the opacity for lines.
- title (str) – The figure title.
- width – The figure width in pixels.
- height (int (default 600)) – The figure height in pixels.
- **kwargs – Other keyword arguments are passed through to the plotly.express.scatter_mapbox constructor, allowing substantial further customization of the resulting figure.
Notes
A separate trace is generated for every unique combination of color and width, which can create a lot of traces and slow down the responsiveness of the figure. It is better to use categorical values in these places.
Returns: Return type: plotly.go.FigureWidget